Charts and data
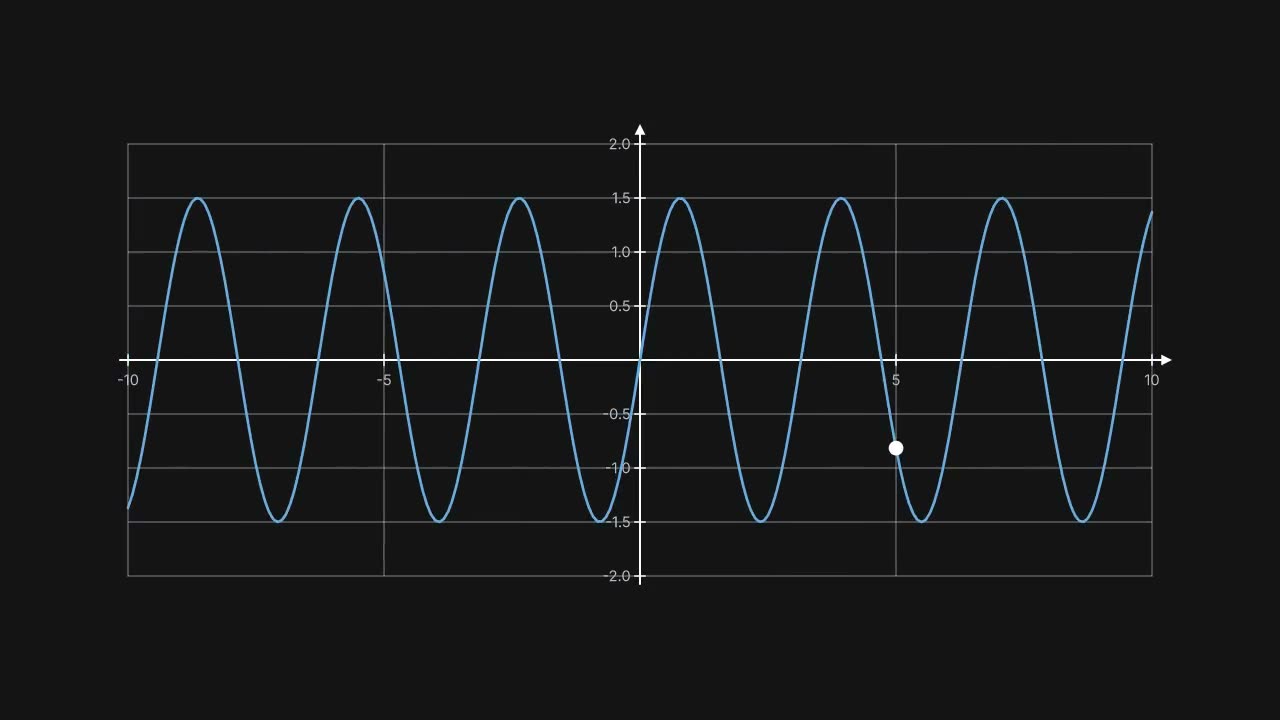
Bars that grow to their values, a line series drawn on, ranges that rescale, and a table whose rows sort themselves. The data is Rust, so it can come from a CSV or an API before the scene starts.
How it is built
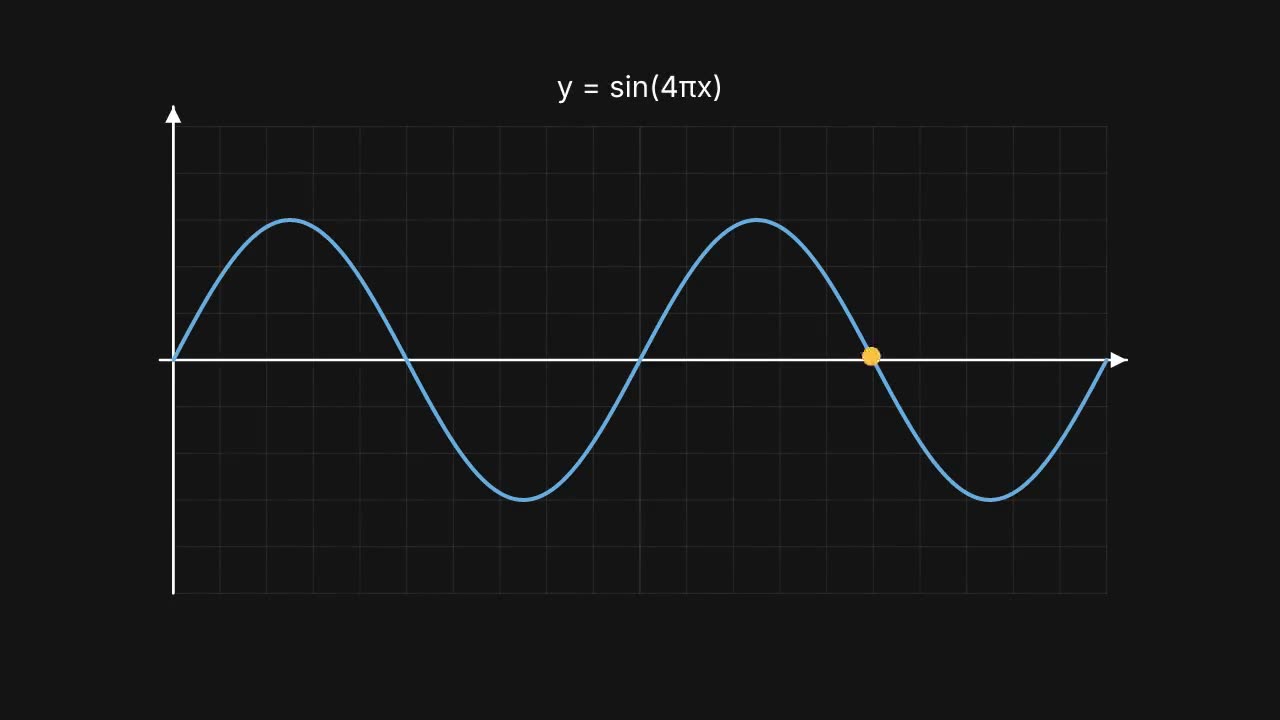
axes.bars,line_seriesandscatter: every value is a signal, so it animates with.to()(charts).- Ranges are signals too:
axes.x_range().to(..)rescales the axes and everything on them. Tableinserts and removes rows and sorts by a column, with the rows sliding into place (tables).- The same project renders on any CI runner with
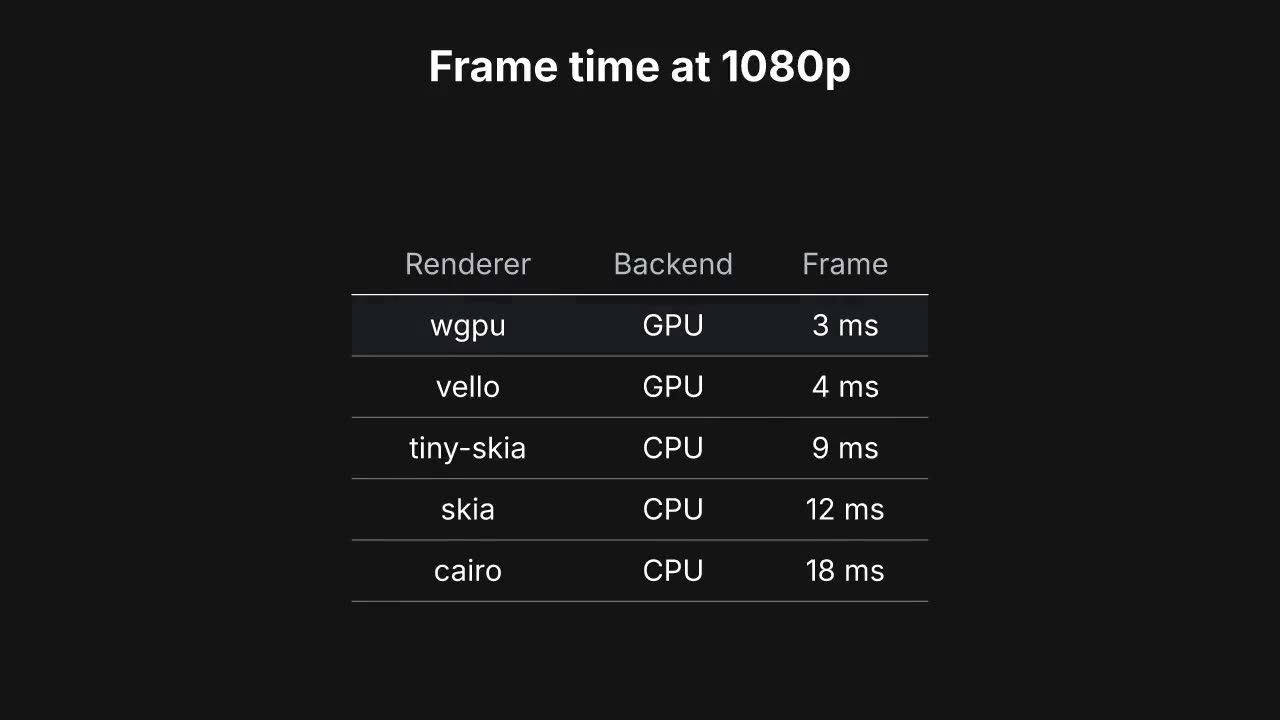
--cpu(rendering).
With an agent
Install the skills, then give your agent a first prompt. The chart-video skill tells it how videos of this kind are made,
and oxframe check shows it what is wrong before anything is rendered.
npx skills add oxygenframe/oxframe-sdkTurn data/sales.csv into a 20-second video: a bar chart per region that grows to its value, then the bars sorted from largest to smallest.