Math animations
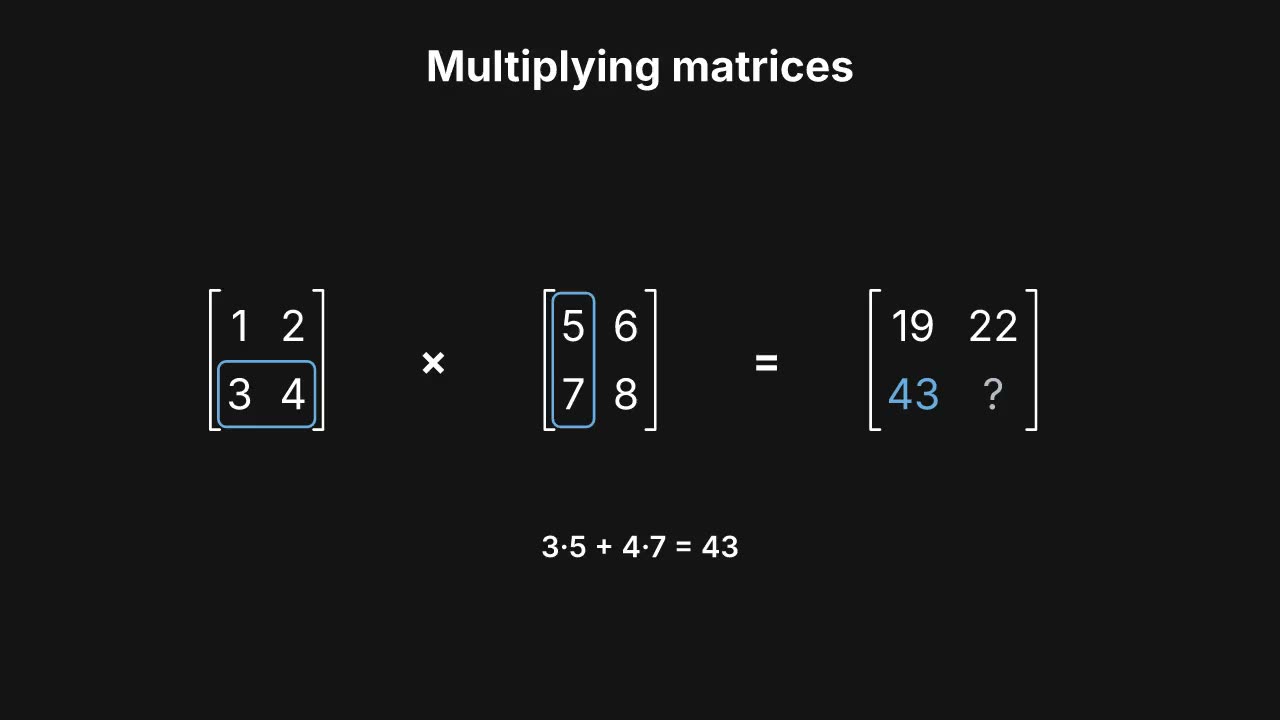
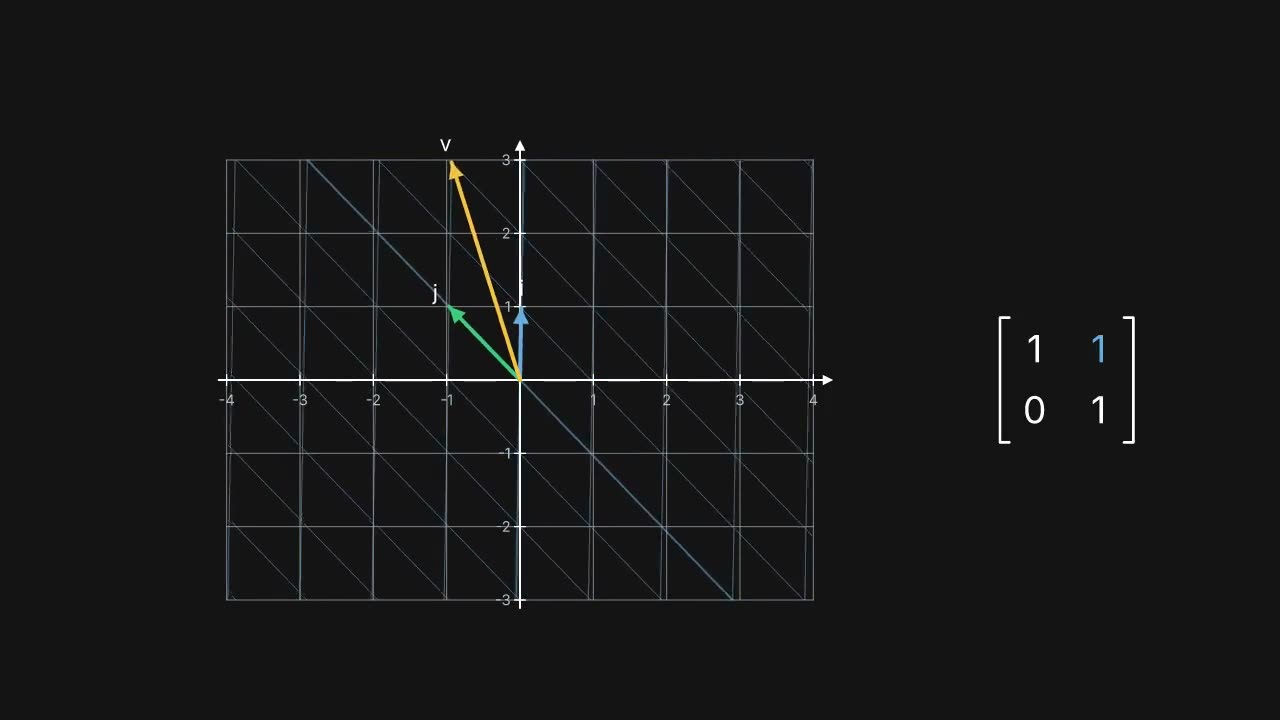
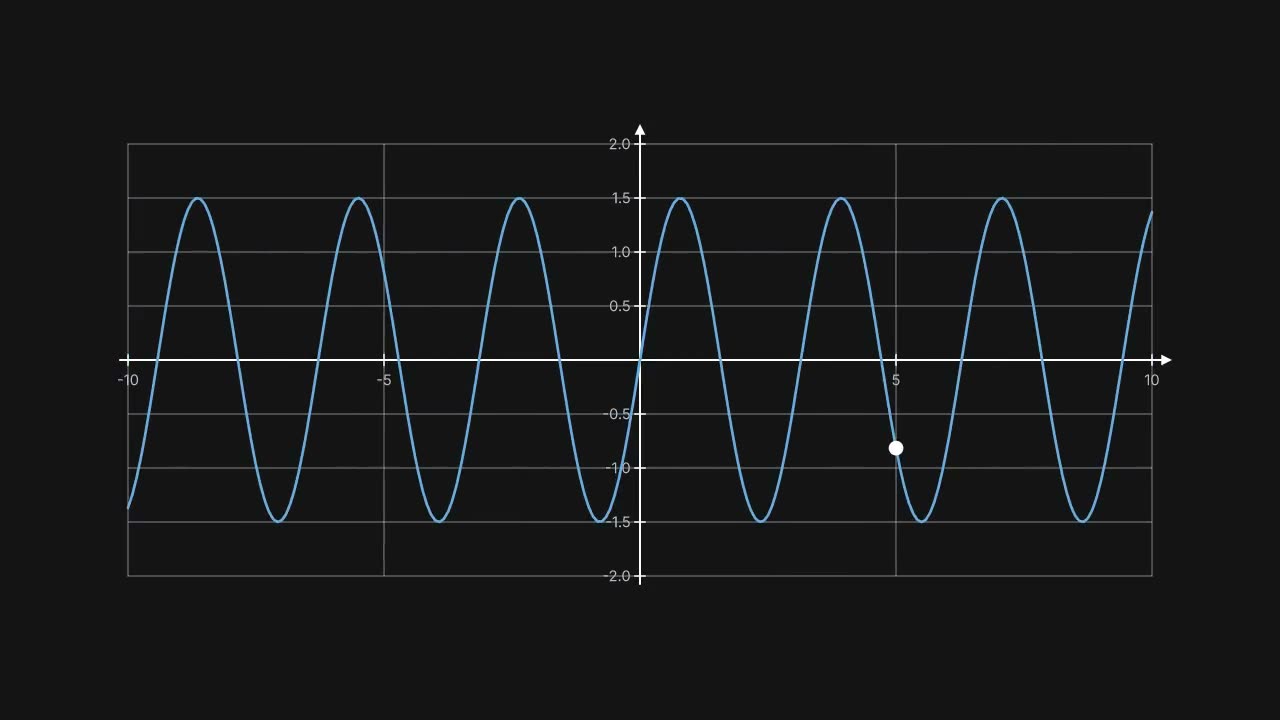
Plots that redraw as their ranges move, vectors and a grid that bend under a linear map, and matrices that multiply step by step. It all runs in the browser playground, with nothing to install.
How it is built
Axesplots any function of x and samples it every frame, so plots follow animated ranges and morph withto_fn(charts).axes.apply_matrixmoves the grid, the vectors and every placed node;Matrixframes rows, columns and cells (matrices).- Any path morphs into any other, and outlines draw on (drawing and morphing).
- Formulas in LaTeX or Typst are not there yet; rich text and Unicode cover short ones.
With an agent
Install the skills, then give your agent a first prompt. The math-explainer skill tells it how videos of this kind are made,
and oxframe check shows it what is wrong before anything is rendered.
npx skills add oxygenframe/oxframe-sdkExplain the dot product in 30 seconds: two vectors on axes, the projection of one onto the other, and the value updating as the angle changes.